https://www.ibm.com/think/topics/latent-dirichlet-allocation
What is Latent Dirichlet allocation | IBM
March 1, 2026LDA resources
February 28, 2026Ganegedara, T. (2025, February 2). Intuitive Guide to Latent Dirichlet Allocation. Towards Data Science.
https://towardsdatascience.com/light-on-math-machine-learning-intuitive-guide-to-latent-dirichlet-allocation-437c81220158/
some blogs
https://johaupt.github.io/blog/Topic_modeling_with_Gibbs_sampling_in_R.html https://agustinus.kristia.de/blog/lda-gibbs/
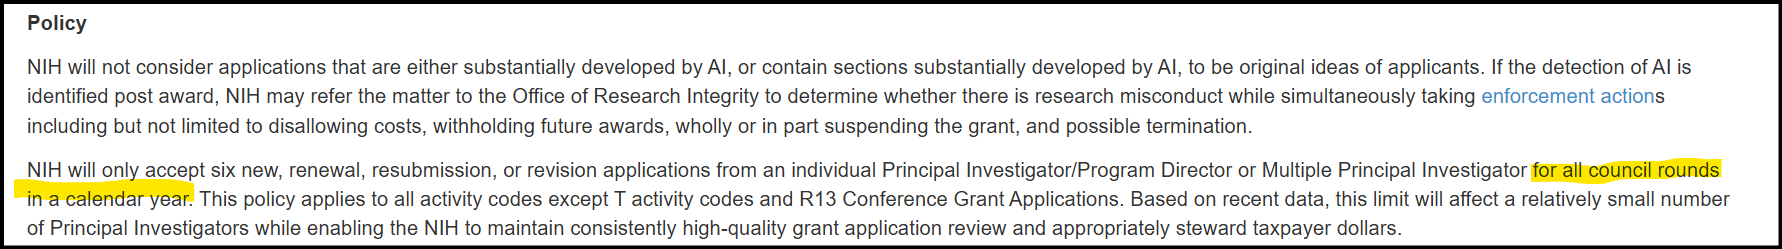
RFA – MPI/PI NIH limit
February 28, 2026the answer… from OSP…
The NIH limitation is by council round, rather than submission date. Council rounds can be found on the NIH standard due dates page: https://grants.nih.gov/grants-process/submit/submission-policies/standard-due-dates
Here is the policy info on the limitation:
https://grants.nih.gov/grants/guide/notice-files/NOT-OD-25-132.html
Some additional guidance (including a table to show which deadlines fit into which year) can be found on the OSP website: https://research-support.yale.edu/sponsored-projects/office-of-sponsored-projects/proposals
Calendar Year 2026
| Advisory Council Dates | Application Due Date | Notes |
|---|---|---|
| January | 5/25/25-9/7/25 | Not included in the count |
| May | 9/25/25-1/7/26 | Included in CY 26 count |
| August or October | 1/25/26-5/7/26 | Included in CY 26 count |
Calendar Year 2027
| Advisory Council Dates | Application Due Dates | Notes |
|---|---|---|
| January | 5/25/26-9/7/26 | Included in CY 27 count |
| May | 9/25/26-1/7/27 | Included in CY 27 count |
| August or October | 1/25/27-5/7/27 | Included in CY 27 count |
Receipt dates:
9/25/2025-5/7/26 6 max
Receipt dates:
5/25-2026 -5/7/27 6 max
list of wars us has fought in with number of casualties normalized by total us population at the time in comparison to deaths from covid and 1918 flu – Google Search
February 28, 2026https://www.google.com/search?q=list+of+wars+us+has+fought+in+with+number+of+casualties+normalized+by+total+us+population+at+the+time+in+comparison+to+deaths+from+covid+and+1918+flu&sca_esv=ff5dab35acd38c25&biw=1318&bih=712&sxsrf=ANbL-n6pHKsOjlgCloXTjQkgQuqLi6LXXg%3A1772298844457&ei=XCKjabjRG6PQ5NoPpsKJgA0&ved=0ahUKEwi477zY1_ySAxUjKFkFHSZhAtAQ4dUDCBE&uact=5&oq=list+of+wars+us+has+fought+in+with+number+of+casualties+normalized+by+total+us+population+at+the+time+in+comparison+to+deaths+from+covid+and+1918+flu&gs_lp=Egxnd3Mtd2l6LXNlcnAilQFsaXN0IG9mIHdhcnMgdXMgaGFzIGZvdWdodCBpbiB3aXRoIG51bWJlciBvZiBjYXN1YWx0aWVzIG5vcm1hbGl6ZWQgYnkgdG90YWwgdXMgcG9wdWxhdGlvbiBhdCB0aGUgdGltZSBpbiBjb21wYXJpc29uIHRvIGRlYXRocyBmcm9tIGNvdmlkIGFuZCAxOTE4IGZsdUgAUABYAHAAeAGQAQCYAQCgAQCqAQC4AQPIAQD4AQGYAgCgAgCYAwCSBwCgBwCyBwC4BwDCBwDIBwCACAA&sclient=gws-wiz-serp QT:{{” The COVID-19 pandemic and the 1918 influenza pandemic resulted in higher U.S. death tolls than most foreign wars in American history. While COVID-19 surpassed the 1918 flu in raw numbers, the 1918 flu had a higher impact relative to the population at the time.
The following list ranks U.S. wars and pandemics by estimated total deaths, with normalized figures for context based on estimates of U.S. population at the time.
www.statnews.com +1
Comparison of US Deaths: Pandemics vs. Wars
Data based on estimates in
National Archives (.gov) +5
Event Total U.S. Deaths (Approx.)Approx. Pop. at TimeNormalized Impact (Per 100k)
1918 Flu Pandemic675,000~103 Million~655
COVID-19 Pandemic1,100,000+~330 Million~333
Civil War (1861-65)620,000–750,000~31-35 Million~1,700–2,100 World War II (1941-45)405,399~132-140 Million~290–307
World War I (1917-18)116,516~103 Million~113–126
Vietnam War58,220~200 Million~29–32
“}}
see you today at 1 pm for ARPA-H
February 27, 2026We don’t have anything like this in Connecticut, but [useful].
NYTimes: What Your DNA Reveals About the Sex Life of Neanderthals
February 26, 2026How Jane Austen revealed the economic basis of society
February 26, 2026https://www.economist.com/christmas-specials/2025/12/12/how-jane-austen-revealed-the-economic-basis-of-society QT:{{” These numbers would all have meant something to Austen’s original readers, argues Mr Copeland, serving as a useful “shorthand” for rank and station. £100 a year was required to afford a single maidservant—“a stout girl of all works”. At £400, a household could employ a cook, housemaid and perhaps a boy servant.
Roughly £700-£1,000 a year was required to keep a carriage. With the help of Highbury’s hypochondriacs, this prize falls within the sights of Dr Perry in “Emma”. The higher income target of £2,000 is eventually met by Marianne in “Sense and Sensibility” when she marries Colonel Brandon. That amount will cover a “proper establishment of servants, a carriage, perhaps two”, and horses for hunting. To satisfy the greater demands of a Mary Crawford, eager for a second home in London, would take at least £4,000 a year. “}}
NYTimes: Super-Agers’ Brains Have a Special Ability, New Study Suggests
February 26, 2026Concepts, estimation and interpretation of SNP-based heritability – Nature Genetics
February 22, 2026See Box 1, viz:
QT:{{”
Box 1 Statistical model used in the GREML approach to estimate hS2NP The statistical model used by GREML can be described in its simplest form as y = Wu + e
where y is an n x 1 vector of standardized phenotypes with n equal to the sample size, W = {wij} is an n x m standardized SNP genotype matrix where m is the number of SNPs, u = {ui} is an m x 1 vector of the additive effects of all variants when fitted jointly in the model, u ~ N(0,Iσ2) with I being an identity matrix, u and e is a vector of residuals, e ~ N(0,Iσ2). An equivalent model is….
y=g+e
g ~ N(0,A…)
A=W W’
In practice, A is called the SNP-derived genetic (or genomic) relationship matrix (GRM) and is estimated from the SNP data. The estimate …from GREML can be described as the estimated variance explained by all the SNPs (mσu) or equivalently as the estimated genetic variance by contrasting the phenotypic similarity
between unrelated individuals to their SNP-derived genetic similarity “}}
https://www.nature.com/articles/ng.3941
Yang, J., Zeng, J., Goddard, M. E., Wray, N. R., & Visscher, P. M. (2017). Concepts, estimation and interpretation of SNP-based heritability. Nature Genetics, 49(9), 1304–1310.
https://doi.org/10.1038/ng.3941
